↜ Back to index Introduction to Numerical Analysis 1
Part a—Lecture 5
In today’s and next week’s lecture we look at some interesting 2nd order ODEs or systems that are used in practice and are usually solved numerically since their solutions cannot be written explicitly in terms of basic functions.
Pendulum
We consider a pendulum of length \ell swinging in a vertical plane. We describe the position of the pendulum by angle \theta = \theta(t) from the vertical line.
Newton’s law implies that \theta = \theta(t) satisfies the second-order ODE \ell \theta'' = -g \sin \theta, where g is the gravitational acceleration.
To be able to find a solution, physicists often approximate \sin \theta \approx \theta for small angles. Then the equation simplifies to \ell \theta'' = -g \theta. With initial condition \theta(0) = \theta_0, \theta'(0) = 0, the exact solution is \theta = \theta_0 \cos(\omega t), \qquad \text{where } \omega = \sqrt{g / \ell}. We see that if |\theta_0| is small, the pendulum oscillates with period approximately T = 2\pi / \omega.
Without the above simplification, which is valid only for small |\theta_0|, we have to use a numerical method to find an approximate solution of the ODE system.
By introducing a new variable v = \theta', we can rewrite it as the first-order ODE system \left\{ \begin{aligned} v' &= -\frac g\ell \sin \theta,\\ \theta' &= v. \end{aligned} \right.
This is a first order ODE system and we can apply any of the methods that we have studied.
Even though we cannot solve the system explicitly, we can still find some information on how the solutions should look like. By multiplying the original 2nd order ODE by \theta', we get 0 = \ell \theta'' \theta ' + g\sin (\theta)\theta' = (\tfrac 12\ell (\theta')^2 -g \cos \theta)', and therefore for any solution the quantity E = \tfrac 12\ell (\theta')^2 - g \cos \theta is constant. If we multiply it with the mass of the pendulum, is the total energy of the pendulum.
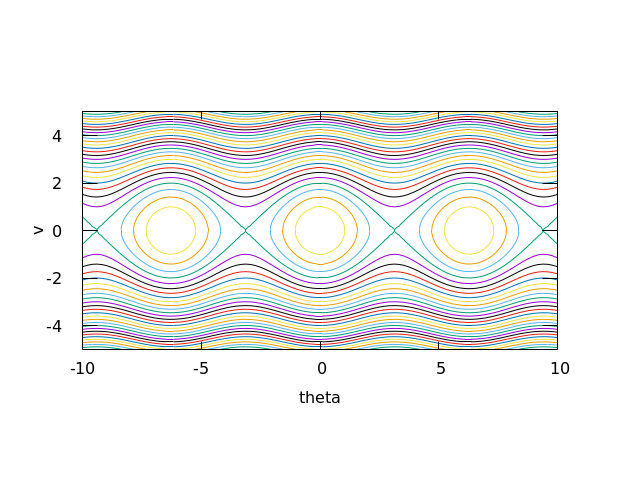
Therefore for any solution \theta(t), v(t) of the first order ODE system, the quantity \phi(\theta, v) := \tfrac 12 \ell v^2 - g \cos \theta is a constant. In other words, any solution of the system will satisfy \phi(\theta(t), v(t)) = C, where C is given by the initial data C = \phi(\theta_0, v_0). Therefore even though we cannot solve the ODE system explicitly, we can plot the parametric plot of (\theta(t), v(t)) by plotting the contours (等高線) of \phi. For example, with \ell = 1 = g, we get

This was produced by the following gnuplot commands:
set view map
unset surface
set contour
set isosamples 100
set cntrparam levels 30
set yrange [-5:5]
set size ratio -1
set xlabel 'theta'
set ylabel 'v'
unset key
splot 0.5 * y**2 - cos(x)
From the contour plot we can see that if v_0 = 0 and \theta_0 \in (-\pi, \pi), the solution will lie on a closed curve and we get a periodic oscillation: the pendulum will be swinging back and forth. On the other hand, if v_0 is sufficiently large, the pendulum will keep turning in one direction only.
Short report
Exercise 1. Write Fortran program that solves the pendulum ODE system with \ell = g = 1 using the midpoint method with time-step h = 0.1.
- Plot the solution \theta(t) as a function of t for \theta_0 = 0.1, v_0 = 0 on the interval [0, 20], together with the exact solution \theta_0\cos(t) of the simplified system. These graphs should match very well.
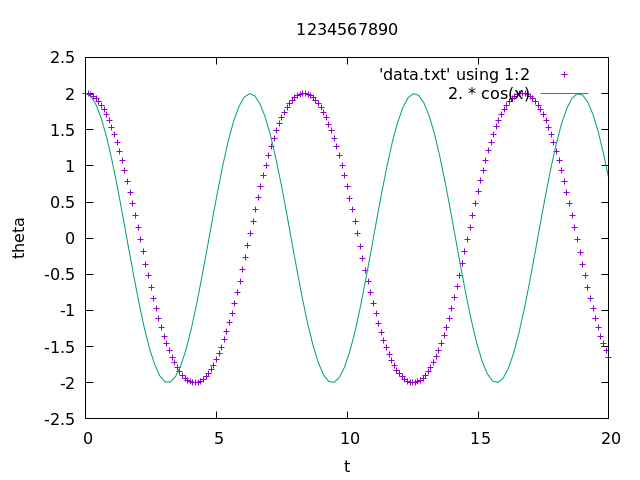
Plot the solution \theta(t) as a function of t for \theta_0 = 2., v_0 = 0 on the interval [0, 20], together with the exact solution \theta_0\cos(t) of the simplified system, as in 1. Now there should be a big difference between them.
Submit this plot to LMS with the title your student ID number.
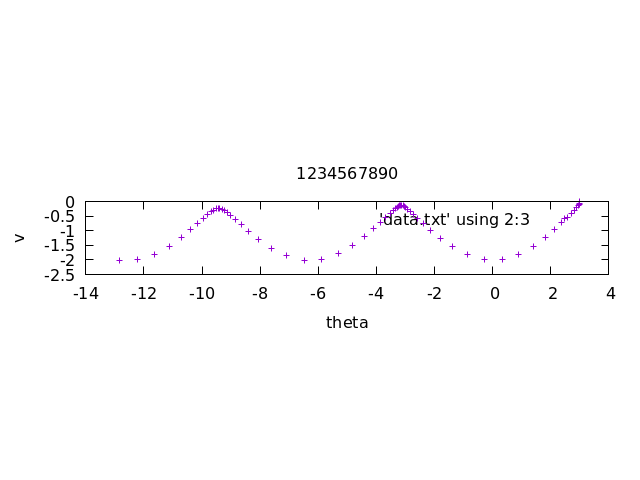
Plot the parametric plot of the solution (\theta(t), v(t)) as a function of t on the interval t \in [0, 20] with \theta_0 = 3..
Submit this plot to LMS with the title your student ID number.
Make another plot of the numerical solution with h = 0.3.
Exercise 2.
Modify the program from Exercise 1 so that it can calculate the period T of the pendulum for given \theta_0 \in (0, \pi) assuming that v_0 = 0.
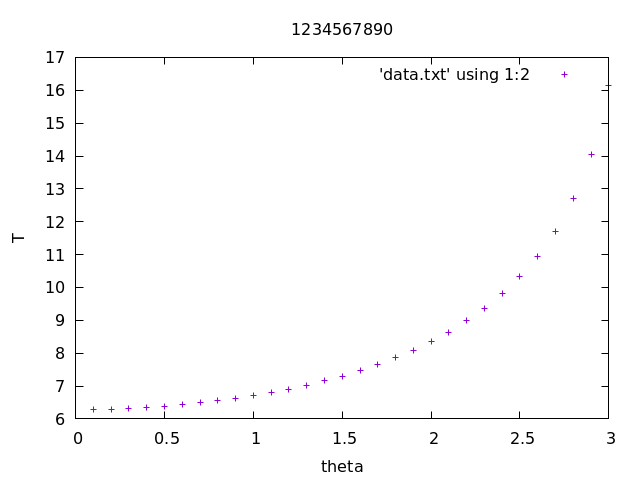
Plot the period as a function of \theta_0 on the interval [0.1, 3] with steps 0.1. Use h = 0.001.
Submit the code and the plot (with the student ID title) to LMS.
Hint. The period is 4t^* where t^* is the first time \theta(t^*) = 0. Your code should estimate t^*.
Example solutions to the exercises
1-2

1-3(another plot with h = 0.3)
(Please submit the plot with h = 0.1)

2
